
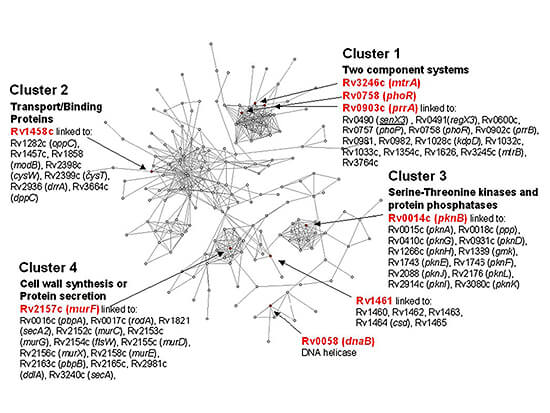
Figure 2. A protein network containing differentially expressed M. tuberculosis genes. The protein network shown here represents genes that are functionally linked by two or more computational methods (Rosetta Stone, Phylogenetic Profile, conserved Gene Neighbor, and Operon methods). Upregulated genes are indicated as red nodes in the network. Most genes in this network are involved in signaling and transport. In cluster 1, we see a number of proteins involved in two-component systems, cluster 2 contains a number of transport and binding proteins, cluster 3 contains serine-threonine kinases and protein phosphatases, and cluster 4 contains cell wall synthesis and protein secretion proteins. Analysis of gene expression data, within the context of protein networks, can help reveal pathways and functional modules involved in disease and infection. (adapted from Rachman H, Strong M et al. Microbes and Infection 8:747-757. 2006.)